
Orbitdash: a server dashboard I can edit
A homelab dashboard with live CPU, memory, and disk stats right next to my service links, and you edit all of it from the browser.
published
length1 min read
I used Homer and then Homarr as the start page for my homelab. Both are basically a list of links, and both keep that list in a YAML file. Adding a service meant opening the file, editing it, and redeploying, which is a weird amount of work just to add one URL.
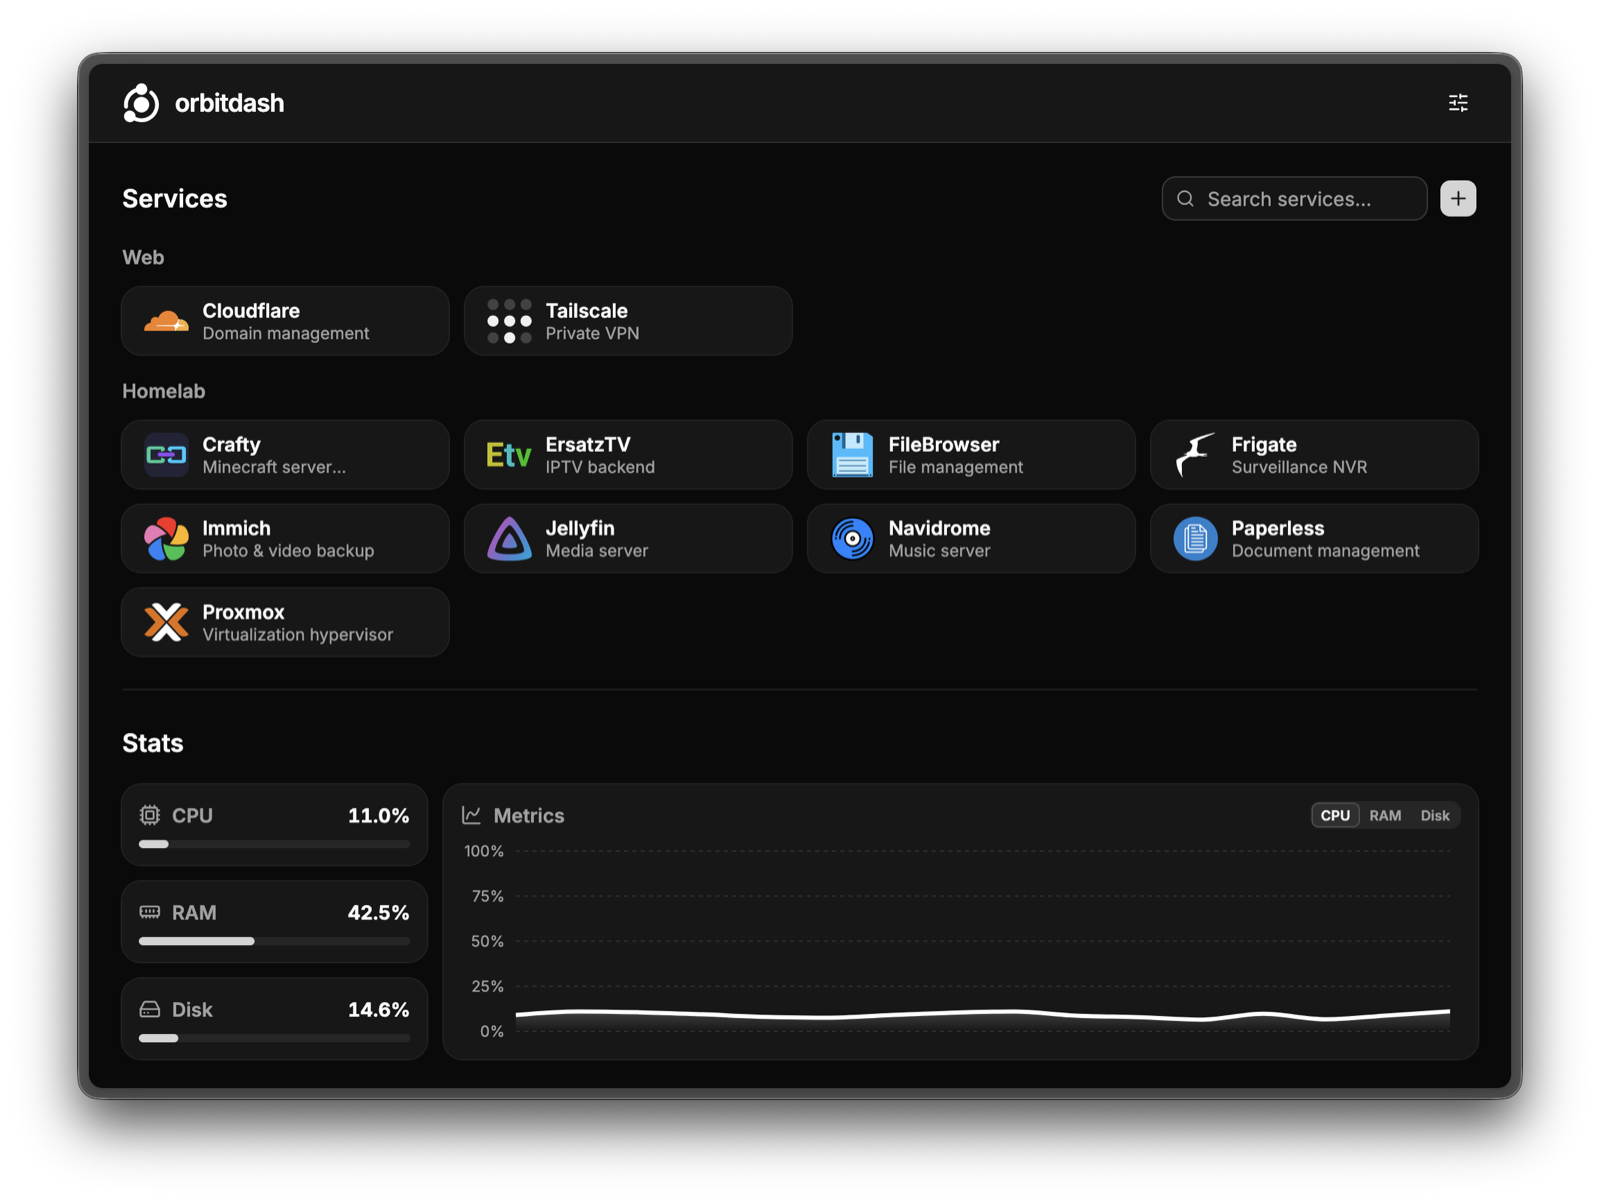
Orbitdash is the dashboard I actually wanted to look at every day. The links are stored in a SQLite database, and you add, edit, and reorder them right in the browser. Live CPU, memory, and disk stats are on the same page, so I don't keep a Grafana tab open anymore just to see if the box is busy.
Day to day
Each service gets an icon, a name, a short description, and a category. You can upload a PNG or SVG for the icon, or paste a URL and Orbitdash will grab it. You can drag categories to reorder them and click to collapse them, and your browser remembers which ones are collapsed. There's a search box for when the list gets long, and you can switch between a 3, 4, or 5 column grid depending on your screen.
The metrics panel keeps the last 60 seconds of data and shows it as a chart, with tabs for CPU, RAM, and disk.
Running it
It's one container with one volume:
services:
  orbitdash:
    image: ghcr.io/chriscorbell/orbitdash:latest
    restart: unless-stopped
    ports:
      - "7770:3000"
    volumes:
      - ./orbitdash-data:/data
The database and uploaded icons are all stored in that volume, so backing up is just copying one folder. Images are built for x86_64 and aarch64, and every commit gets its own tag alongside latest if you want to pin a specific build.
It's built with TypeScript, React, Tailwind, shadcn/ui, Hono, Bun, and SQLite. My favorite part is that I haven't had to open a config file since.